Query Monitor is a WordPress plugin that includes several debugging tools, including a profiling feature that you can use to investigate running time and memory usage of specific code, find out more below.
Table of Contents
What is Query Monitor?
As you’ve come across this blog post, you probably already know what Query Monitor is, skip this if you do!
Query Monitor is a WordPress plugin created by John Blackbourn. It enables a developer tools panel that facilitates the debugging of various elements, including database queries, PHP errors, hooks and actions, Block Editor components, enqueued scripts and stylesheets, HTTP API requests, and additional functionalities. At the time of writing, it has over 200,000 active installations.
Query Monitor can be used for all kinds of debugging tasks, in this blog post, I am focusing specifically on its ability to profile specific code in WordPress.
🚀 Looking to Boost Your WordPress or Woo Site?
-
WordPress & WooCommerce Hosting
Managed hosting, optimised speed, and strong security. -
WooCommerce Extensions & Themes
Browse WooCommerce extensions and themes.
These are affiliate links where I may earn a commission.

What is Profiling?
By utilising Query Monitor’s profiling feature, you can add a few lines of code around certain PHP functionality. Then when this code is run, Query Monitor logs the running time and memory usage.
Once that data is logged, you can then see it in Query Monitor’s timing panel, showing the time and memory usage of the specific piece of code profiled.
This allows you to better understand the timing/memory usage of specific pieces of your code, generally used for performance optimisation purposes.
How to Use Profiling in Query Monitor
Using profiling in Query Monitor is simple, you just need to add a few lines to the code you want to profile.
Add The Profiling Code
To apply profiling to a specific block of code, you add:
do_action( 'qm/start', 'reference' );at the startdo_action( 'qm/stop', 'reference' );at the end
Optionally, you can also add do_action( 'qm/lap', 'reference' ); to track how long iterations take, such as when in a while loop.
Replace reference with your own, I like to use the function name I am profiling. This name will appear in the timings panel of Query Monitor.
Example Code
Here is some example code that intentionally takes a long time to load:
function qmtest_get_dates() {

	do_action( 'qm/start', 'get_dates' ); // Start profiling

	$dates = array();
	$current = strtotime( '2010-01-01' );
	$to = strtotime( '2025-01-01' );

	while ( $current <= $to ) {

		if ( qmtest_check_date_valid( gmdate( 'Y-m-d', $current ) ) ) {

			$dates[] = gmdate( 'Y-m-d', $current );

		}

		$current = strtotime( '+1 day', $current );

		do_action( 'qm/lap', 'get_dates' );  // Log a lap

	}

	print_r( $dates );

	do_action( 'qm/stop', 'get_dates' ); // Stop profiling

}
add_action( 'wp_footer', 'qmtest_get_dates' );

function qmtest_check_date_valid( $date ) {

	$valid = true;
	$invalid_dates = array();
	$current = strtotime( '2020-01-01' );
	$to = strtotime( '2021-01-01' );

	while ( $current <= $to ) {

		$invalid_dates[] = gmdate( 'Y-m-d', $current );
		$current = strtotime( '+1 day', $current );

	}

	if ( in_array( $date, $invalid_dates ) ) {

		$valid = false;

	}

	return $valid;

}In the above example, I’ve created a new qmtest_get_dates function that returns an array of “valid” dates between 2 dates, whether or not a date is valid is handled by a qmtest_check_date_valid function, which intentionally generates its own array of invalid dates.
Obviously, when running the qmtest_get_dates function, the qmtest_check_date_valid function is going to get called for every date between a very long period, and that means due to how the qmtest_check_date_valid function has been coded, each iteration is then going to generate an array of invalid dates, slowing things down.
You’ll see that I’ve included the Query Monitor profiling code in the qmtest_get_dates function to track how much time/memory is being used by this function.
Let’s see below how that now looks in Query Monitor.
Timings Tab
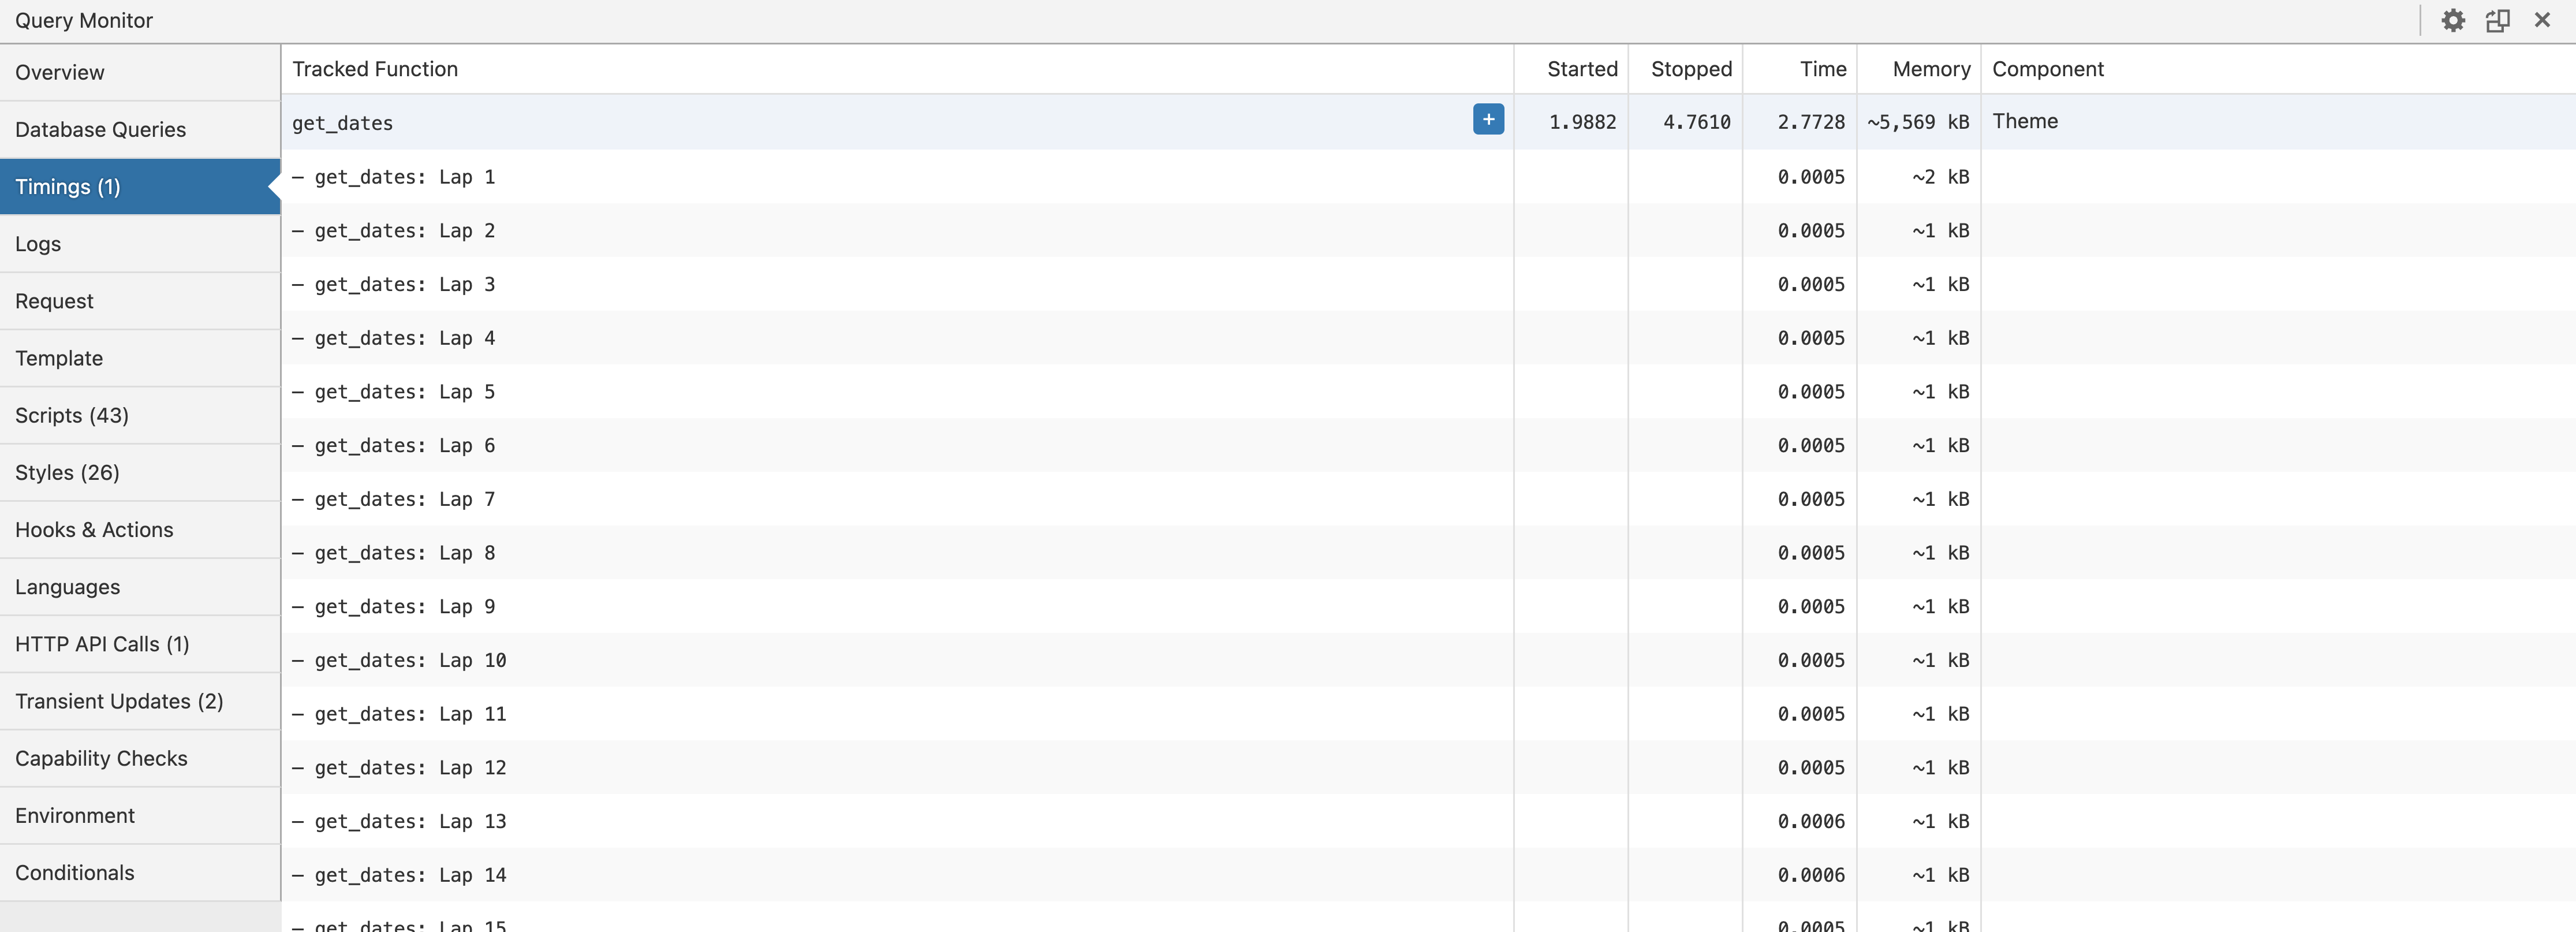
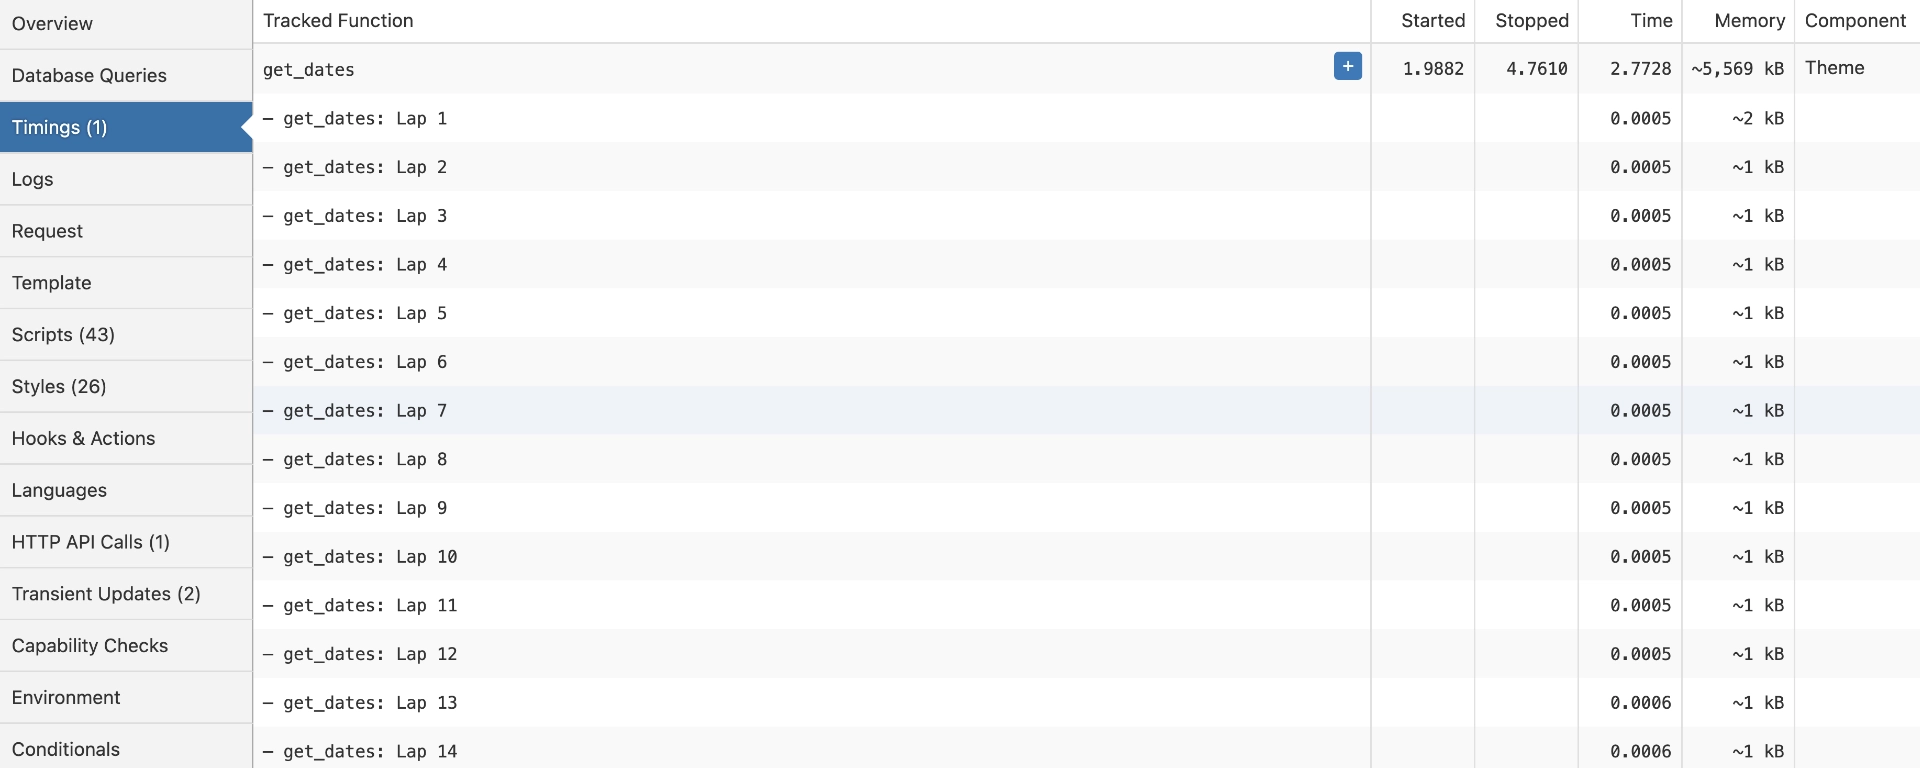
With Query Monitor open, when loading the page using the qmtest_get_dates function, you’ll see a timings tab. If you click that you’ll see the following information:

This first row (highlighted) is the overall function, we can see here the following details:
- Tracked Function
- This is the name you specified when adding the Query Monitor profile code
- Started and Stopped
- The time the function was started/stopped in relation to the overall load time
- Time
- The total time taken in seconds for the function to run
- Memory
- The memory used by the function
- Component
- The component this function was called from, e.g., if your code is in your theme’s
functions.phpfile, then it would showTheme
- The component this function was called from, e.g., if your code is in your theme’s
You can also click the plus icon to see where the function was called:

You’ll also notice there are multiple rows below this, these are present due to the use of do_action( 'qm/lap', 'get_dates' ). I added this code in the while loop so that I could track the time/memory used for each iteration when populating the dates array.
This is useful as it gives insight into the time and memory used for each iteration.
Note that the times and memory usage displayed in the Timings panel should be treated as approximations, because they are recorded at the PHP level and can be skewed by your environment and by other code.
Information from the Query Monitor documentation
Now that you are aware of the time/memory used by specific parts of your code, you can then look to perform performance optimisations or refactor your code to reduce load times and memory usage.
Query Monitor offers an easy way to perform basic approximate profiling of your code in WordPress. If you’d like more accurate timings and/or more in-depth profiling, check out New Relic.
More Reading
- Query Monitor website
- Query Monitor at WordPress.org
- Query Monitor at GitHub
- Query Monitor profiling and logging documentation
